Locating and Ordering Integers on the Number Line
Learning Outcomes
- Locate positive and negative numbers on a number line
- Compare and order positive and negative numbers using a number line
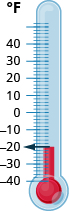 Temperatures are not the only negative numbers. A bank overdraft is another example of a negative number. If a person writes a check for more than he has in his account, his balance will be negative.
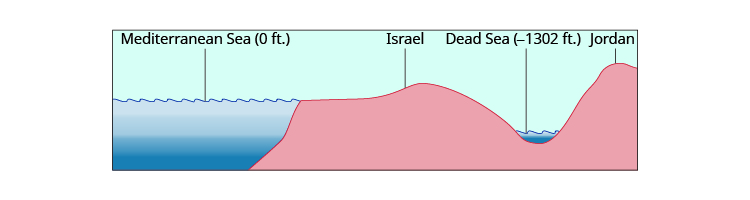
Elevations can also be represented by negative numbers. The elevation at sea level is feet. Elevations above sea level are positive and elevations below sea level are negative. The elevation of the Dead Sea, which borders Israel and Jordan, is about feet below sea level, so the elevation of the Dead Sea can be represented as feet. Refer to the image below for a depiction.
The surface of the Mediterranean Sea has an elevation of ft. The diagram shows that nearby mountains have higher (positive) elevations whereas the Dead Sea has a lower (negative) elevation.
Temperatures are not the only negative numbers. A bank overdraft is another example of a negative number. If a person writes a check for more than he has in his account, his balance will be negative.
Elevations can also be represented by negative numbers. The elevation at sea level is feet. Elevations above sea level are positive and elevations below sea level are negative. The elevation of the Dead Sea, which borders Israel and Jordan, is about feet below sea level, so the elevation of the Dead Sea can be represented as feet. Refer to the image below for a depiction.
The surface of the Mediterranean Sea has an elevation of ft. The diagram shows that nearby mountains have higher (positive) elevations whereas the Dead Sea has a lower (negative) elevation.
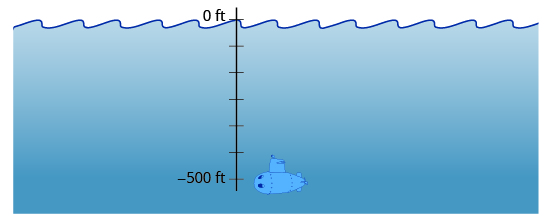
 Depths below the ocean surface are also described by negative numbers. A submarine, for example, might descend to a depth of feet. Its position would then be feet as labeled in the image below.
Depths below sea level are described by negative numbers. A submarine ft below sea level is at ft.
Depths below the ocean surface are also described by negative numbers. A submarine, for example, might descend to a depth of feet. Its position would then be feet as labeled in the image below.
Depths below sea level are described by negative numbers. A submarine ft below sea level is at ft.
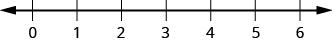
 Both positive and negative numbers can be represented on a number line. Recall that the number line created in Add Whole Numbers started at and showed the counting numbers increasing to the right as shown in the number line below. The counting numbers on the number line are all positive. We could write a plus sign, , before a positive number such as or , but it is customary to omit the plus sign and write only the number. If there is no sign, the number is assumed to be positive.
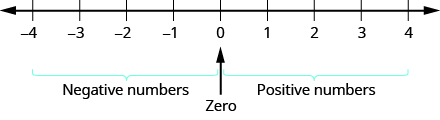
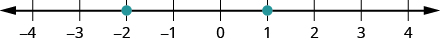
 Now we need to extend the number line to include negative numbers. We mark several units to the left of zero, keeping the intervals the same width as those on the positive side. We label the marks with negative numbers, starting with at the first mark to the left of at the next mark, and so on. Refer to the number line below for reference.
On a number line, positive numbers are to the right of zero. Negative numbers are to the left of zero. What about zero? Zero is neither positive nor negative.
Now we need to extend the number line to include negative numbers. We mark several units to the left of zero, keeping the intervals the same width as those on the positive side. We label the marks with negative numbers, starting with at the first mark to the left of at the next mark, and so on. Refer to the number line below for reference.
On a number line, positive numbers are to the right of zero. Negative numbers are to the left of zero. What about zero? Zero is neither positive nor negative.
 The arrows at either end of the line indicate that the number line extends forever in each direction. There is no greatest positive number and there is no smallest negative number.
Doing the Manipulative Mathematics activity "Number Line-part 2" will help you develop a better understanding of integers.
The arrows at either end of the line indicate that the number line extends forever in each direction. There is no greatest positive number and there is no smallest negative number.
Doing the Manipulative Mathematics activity "Number Line-part 2" will help you develop a better understanding of integers.
example
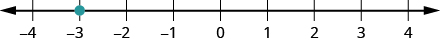
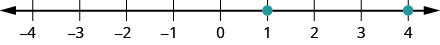
Plot the numbers on a number line: 2. To plot , start at and count three units to the left. Place a point as shown in the number line below.
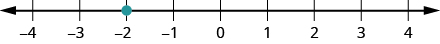
 3. To plot , start at and count two units to the left. Place a point as shown in the number line below.
Order Positive and Negative Numbers
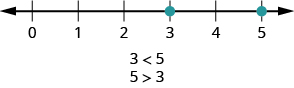
We can use the number line to compare and order positive and negative numbers. Going from left to right, numbers increase in value. Going from right to left, numbers decrease in value. See the number line below.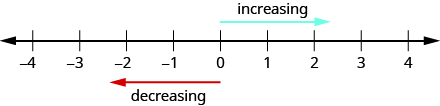 Just as we did with positive numbers, we can use inequality symbols to show the ordering of positive and negative numbers. Remember that we use the notation (read is less than ) when is to the left of on the number line. We write (read is greater than ) when is to the right of on the number line. This is shown for the numbers and in the image below.
The number is to the left of on the number line. So is less than , and is greater than .
Just as we did with positive numbers, we can use inequality symbols to show the ordering of positive and negative numbers. Remember that we use the notation (read is less than ) when is to the left of on the number line. We write (read is greater than ) when is to the right of on the number line. This is shown for the numbers and in the image below.
The number is to the left of on the number line. So is less than , and is greater than .
 The numbers lines to follow show a few more examples.
 is to the right of on the number line, so .
is to the left of on the number line, so .
is to the right of on the number line, so .
is to the left of on the number line, so .
 is to the left of on the number line, so .
is to the right of on the number line, so .
is to the left of on the number line, so .
is to the right of on the number line, so .
 is to the right of on the number line, so .
is to the left of on the number line, so .
is to the right of on the number line, so .
is to the left of on the number line, so .
example
Order each of the following pairs of numbers using ; or 14[/latex]___[latex]6 -1[/latex]___[latex]9 -1[/latex]___ [latex]- 4 2[/latex]___ [latex]- 20Answer:
Solution:
Begin by plotting the numbers on a number line as shown in the number line below.

| 1. Compare and . | 14___6 |
| is to the right of on the number line. |
| 2. Compare and . | -1___9 |
| is to the left of on the number line. |
| 3. Compare and . | -1___ - 4 |
| is to the right of on the number line. |
| 4. Compare and . | -2___ - 20 |
| is to the right of on the number line. |
